Using purrr:map to add jitter to ggplot arts
2021-05-13
2-minute read
What’s up everyone, double post for me today 💪💪💪
I just read Ch.9, “Functionals” of Advanced R, which talks about functional programming syntaxes like purrr::map. I’ve always kinda known how to use map, but for the most part, didn’t use too much. I just so happened to be interested in generative art right now, so geometry and stuff. Which, is a fantastic application for purrr:map!
Here’s a circle:
library(tidyverse)
theme_set(theme_light())

npoints <- 10000

df <- tibble(
  id = 1:npoints,
  x = cos(2*pi/npoints * id),
  y = sin(2*pi/npoints * id)
)

df %>%
  ggplot(aes(x, y)) +
  geom_point() +
  coord_equal()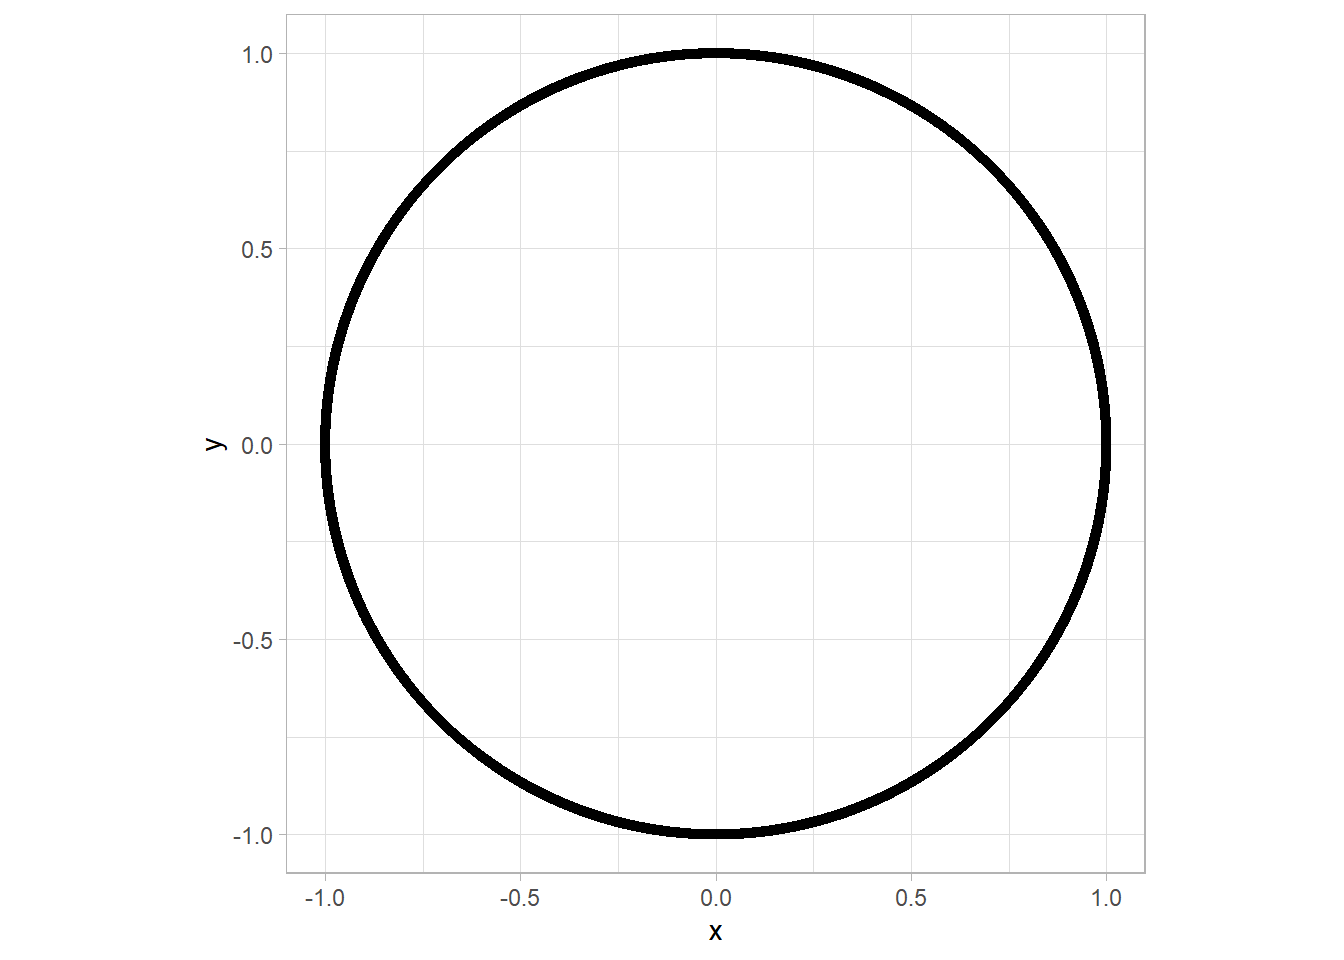
So just a 10000 row tibble. We use the row number to divide 2pi, and plot x,y of a circle.
Now, if we wanted to draw a random number from a uniform distribution per row, we can do:
set.seed(9)

df <- df %>%
  mutate(x = map_dbl(x, ~ .x + runif(n = 1, min = -0.2, max = 0.2)),
         y = map_dbl(y, ~ .x + runif(n = 1, min = -0.2, max = 0.2)),
         l = map_dbl(y, ~ runif(n = 1, min = 0, max = 1)))

df %>%
  ggplot(aes(x, y, color = l)) +
  geom_point(alpha = 0.1) +
  coord_equal() +
  theme_void() +
  scale_color_gradient2(low = "#F71735", high = "#41EAD4", midpoint = 0.5) +
  theme(
    plot.background = element_rect(fill = "#000000"),
    legend.position = "none"
  )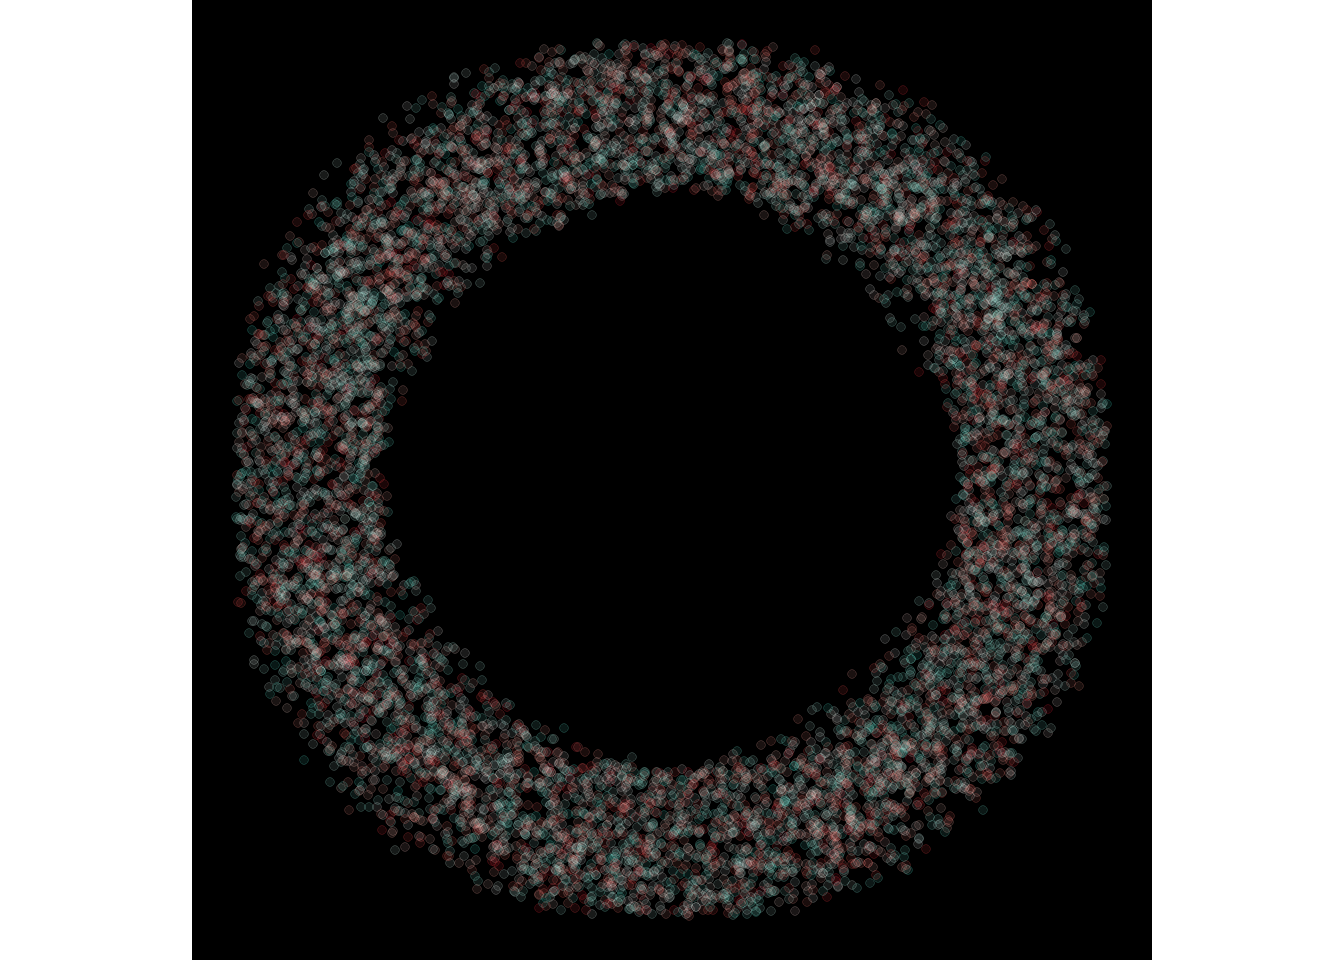
This was possible because the formula was executed at every item inside the list (a column)
purrr magic at it again, so much to learn!